In the project Creative Nation Nesta maps the creative industries in the UK showing different aspects such as the evolution and contribution to local economic development. For this purpose official and open data is used and the result is a report presenting the key findings.
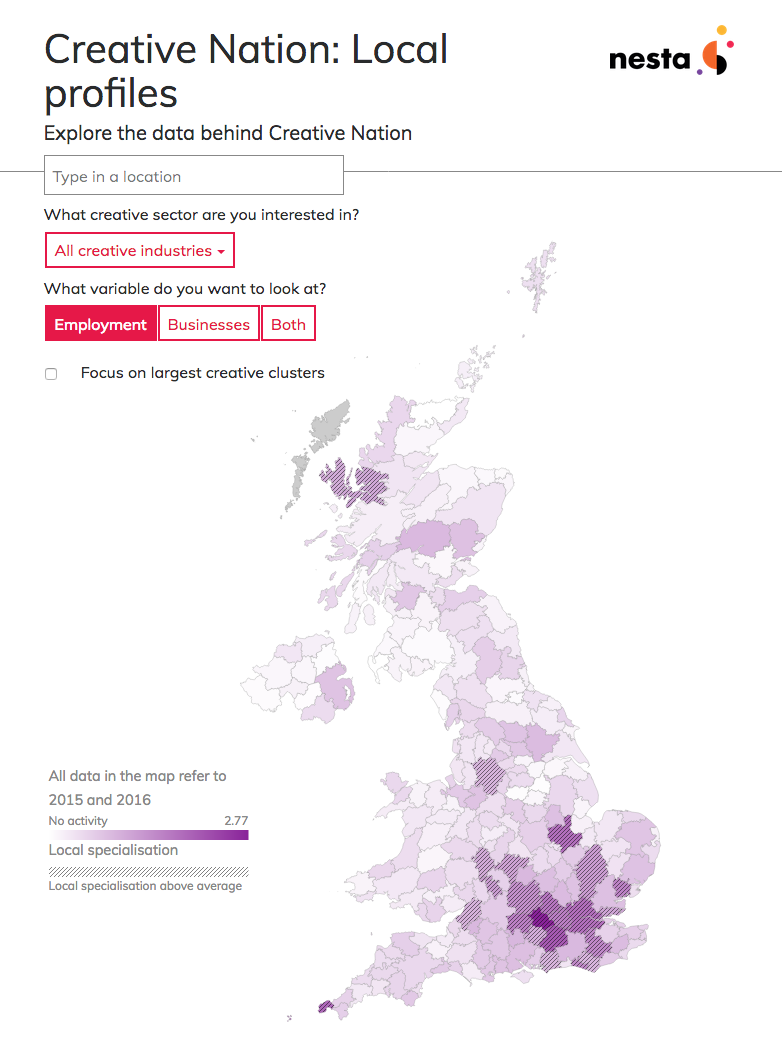
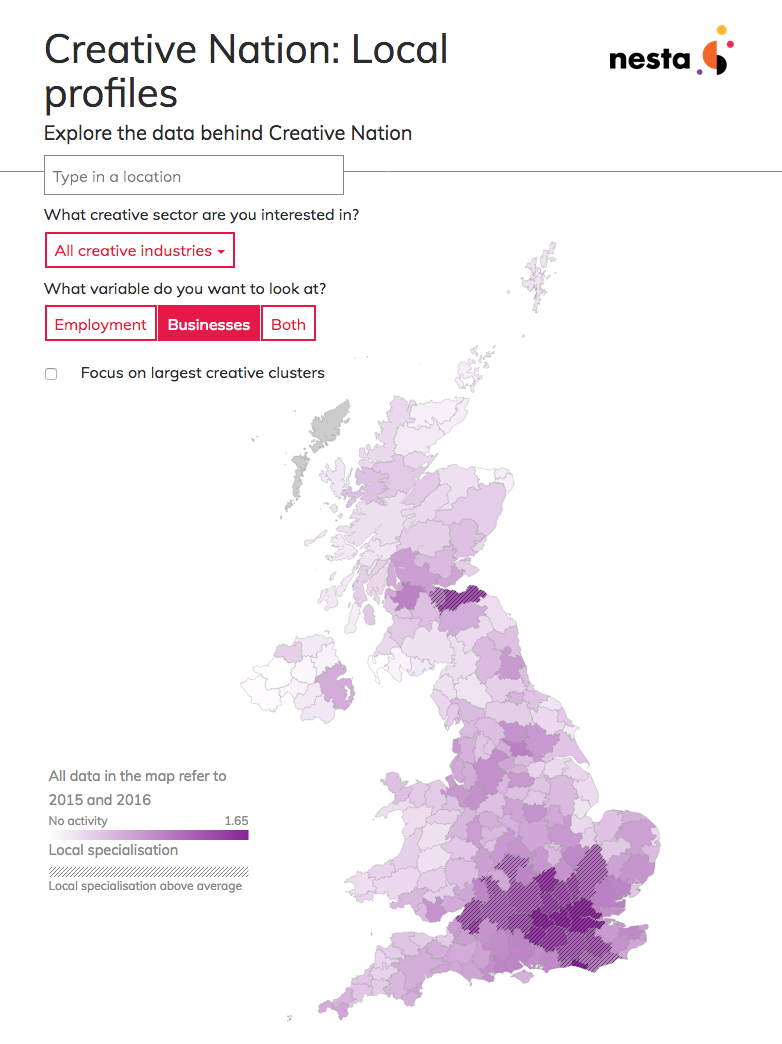
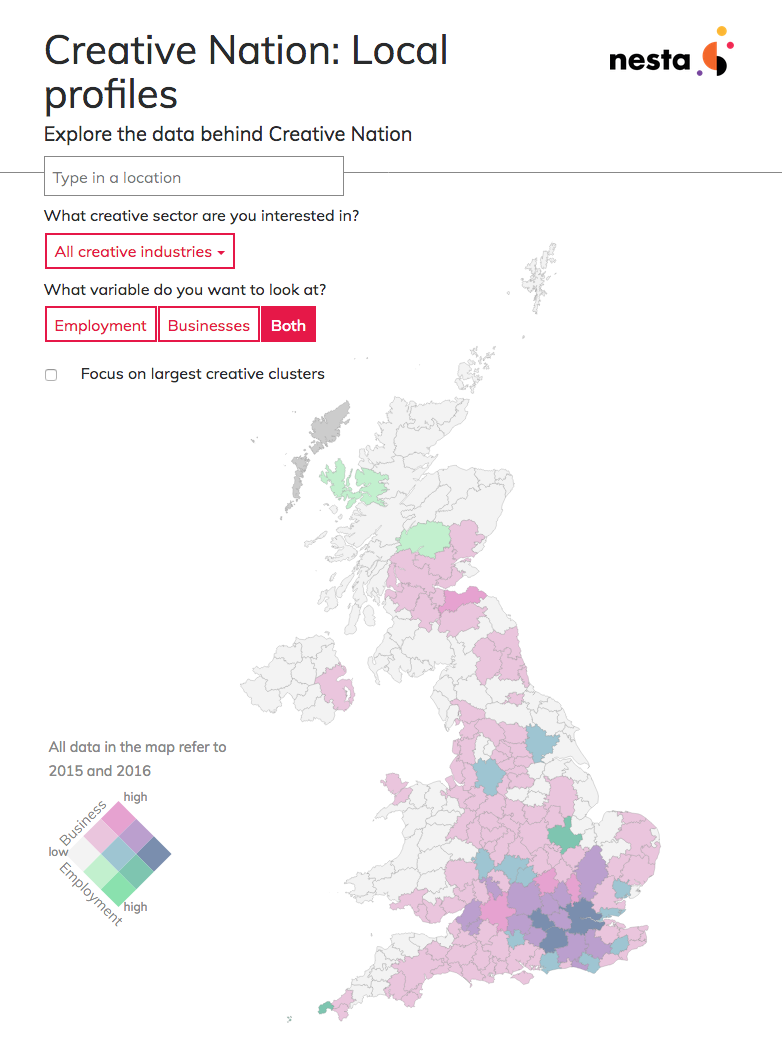
As part of the project I created the interactive visualisation "Creative Nation: Local profiles" which allows exploring the results for the different locations in UK. The visualisation consists of a map showing local specialisation in terms of number of businesses, employment or both. It's possible to view all creative industries or select one of them.
When selecting one location additional information and charts are displayed presenting the composition of the local creative industries and the growth.

1

2

3
Choropleth map showing local specialisation in terms of employment [1] and number of businesses [2]. A bivariate choropleth has been used to show both variables at the same time [3].